Our client approached us looking for a hospital patient room that they could use with their Oculus Quest 2 hardware. The patient room would serve as a base environment for hospital staff training scenarios and would be based off the previous scene we created in Unreal Engine for the “Hospital VR Mockup” project. The original scene was built targeting desktop PC performance, so my challenge here was porting the scene to a mobile platform while attempting to maintain both visual quality and frame rate performance.
Step 1: Reduce asset polygon count with LODs

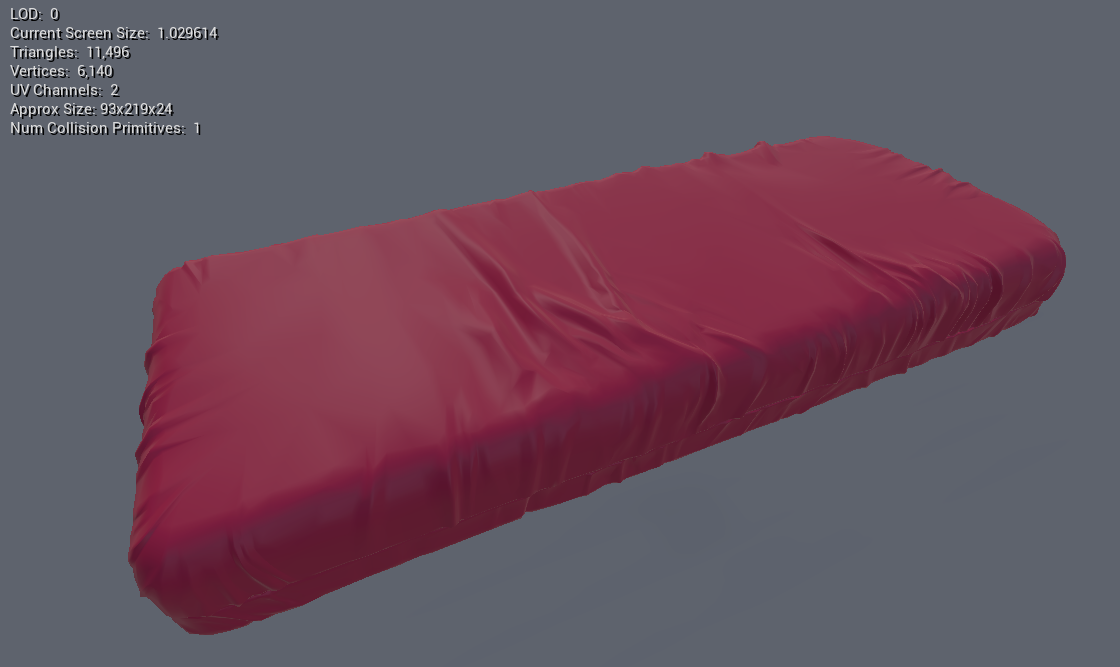
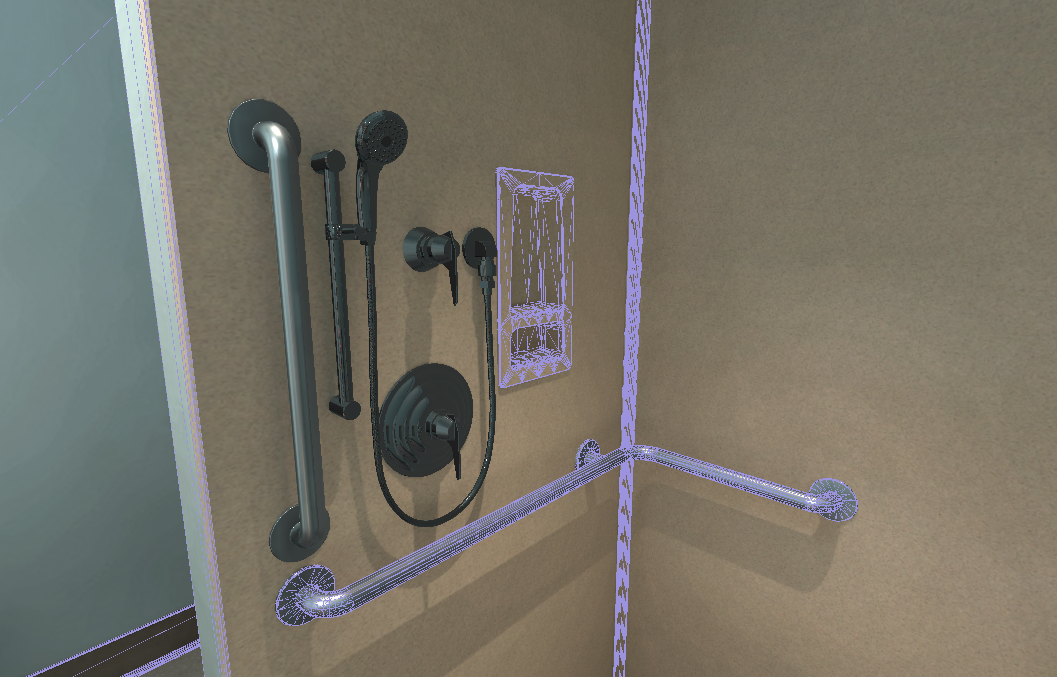
My first objective was to reduce the overall scene triangle count as much as possible. I focused on the most complex objects first: the patient bed, medical equipment, wires, and bathroom fixtures. In most cases I was able to apply reductions between 75 and 85 percent without generating visual artifacts. After all LOD reduction was complete, the total scene triangles dropped from ___ to 590k.
Step 2: Reduce texture sizes and unify materials
Many of the original asset textures were generated from Substance with high resolution outputs at 2k or 4k. For special graphic textures, such as logos or screen interfaces, I titrated the resolution down as much as possible without losing visible graphical clarity. This was especially important for any materials showing text. Next, I focused on textures with obvious patterns, such as wood or tile, and reduced these to a baseline 512×512 size. For the remaining textures that used non-obvious patterns, such as paint or metal, I further reduced these to 128×128 since the textures would be hardly noticeable.
In addition to the textures, I also utilized Unreal’s master/child material system to unify the material collection to reduce draw calls. Master materials were created for primitives like basic diffuse, metal, and glass, with specific child materials derived from these for each asset.
After making these adjustments, the texture memory consumption was reduced to roughly 500 Mb during play.
Step 3: Simplify/override collision

Next, I analyzed the assets in the scene to determine where I could disable or simplify collision. Walls and floor were left at their default settings. Other large objects in the room which affected movement–including furniture and fixtures–were set to use their simplified collision mesh. This was especially important for assets like the patient bed mattress shown above where enabling complex collision on a high-polygon asset would introduce far too much complexity. Most other wall-mounted assets also had their collision settings removed.
Step 4: Reduce dynamic light count
The original scene contained several dynamic lights which would have allowed the user to turn lights on or off or modify their intensity. For the Quest 2 port, this feature was not necessary, so all interior lights were converted to static to be included in the light baking. The sun system was left as the only stationary light in the scene.
Step 5: Diagnosing performance spikes
After making the above adjustments, I began testing the scene on the Quest 2 hardware and through the Unreal Insights profiling tool. The baseline frame render time was significantly improved, but I noticed a few remaining performance spikes when playing through the scene. The spikes occurred whenever the user’s laser pointer hovered over an object–usually one of the more complex objects with high polygon counts or multiple materials.
Going back into the project, I noticed the laser pointer was using a visibility trace to project the end point of the laser which also had a point light to illuminate the nearest object. I first tried turning off collision for visibility traces on these complex objects where they weren’t needed, thinking the performance spike was caused from having to load and compute the projection point on a complex collision mesh, but this did not seem to provide much help. Realizing that the point light–a movable light source–was highly inefficient with Android, I decided to turn it off completely. Surely enough, after disabling the laser’s point light the performance spikes disappeared when hovering over any objects in the scene.
Results

The above profiling session from Unreal Insights shows the performance spikes have disappeared and the average baseline frame render time is around 5-10 ms.